Tuesday 6th October
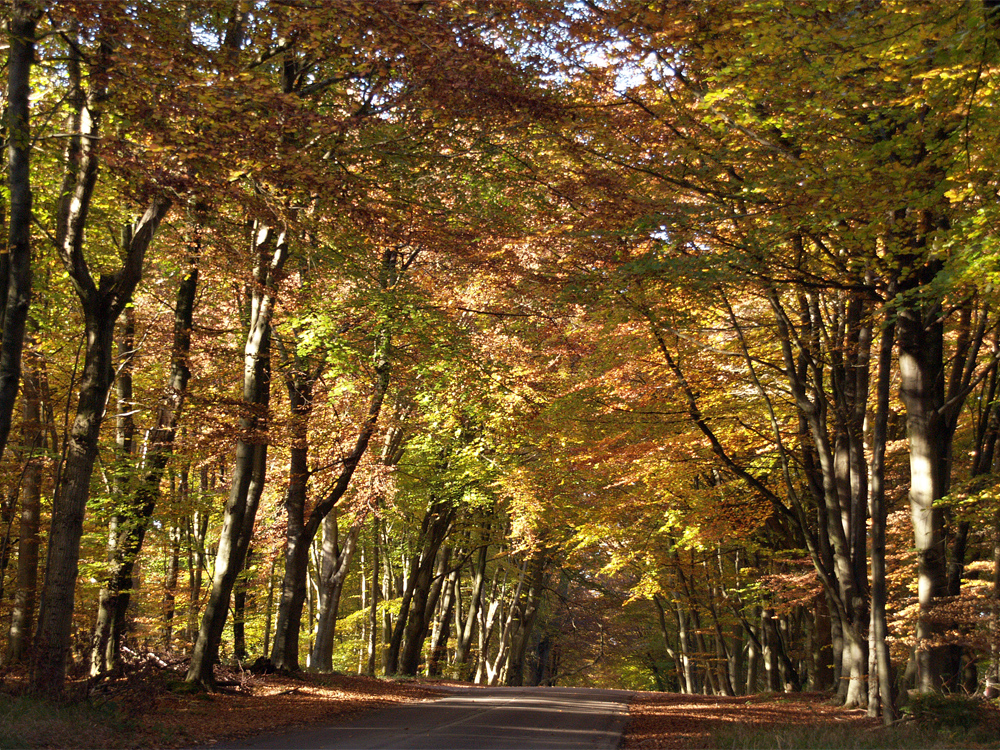
Monday was another dry and warm early Autumn day with the thermometer still rising above the average, +5.6C, with a peak of 20.5C at 15.10. The last night was also mild with a minimum of 11.9C at 06.16 early Tuesday being 4.4C above average.
Af first light on Tuesday there was no evidence of fog but just after 07.00 a whisper of radiation fog began to form in the River Og valley that thickened as the temperature began to rise and then fall again around sunrise. By 08.15 the fog had thinned and lifted from the valley.
The barometric pressure continues to ebb away, down another 5mb since yesterday, as the high pressure withdraws westwards and the depression to the north begins to replace it. Later this afternoon there will be a significant change in direction from a general southwesterly to north, as a result of these pressure changes.
A depression has recently been forming over the Bay of Biscay and Portugal that will emphasise the change in weather pattern. This evening and tomorrow it will push northwards with the moist, warm air from the south colliding with the cooler air from the north. There is now considerable confidence that this meeting of opposing air streams will produce a significant fall of rain over southern England during Wednesday morning. The first light rain is likely to arrive just after midnight and become heavy around dawn.
During late Wednesday afternoon the weather front will move away eastwards that will see the clouds thin and the rain stop. By Thursday the wind will have backed into the northwest resulting in sunny intervals appearing, but the maximum temperature will below average, making it feel chilly compared to recent days.
Part 2 of the Met Office article on the HadUK-Grid using data from numerous weather stations across the UK
From observing points to a continuous map
To fill the spaces between weather stations, HadUK-Grid uses a commonly-used statistical technique known as interpolation. This extends information from observing sites across the surrounding area and accounts for geographical influences such as distance, terrain, altitude and proximity to the coast.
The result is a continuous map that reflects the varied geography of the UK rather than simply presenting a series of isolated observations. In order to represent the UK on a grid, the dataset divides the country into grid squares measuring one kilometre across. Each square contains a scientifically derived estimate of the climate at that location.
These estimates cover a broad range of climate variables, including maximum, minimum and mean temperature, rainfall, sunshine and frost days. Because they are brought together in a consistent system, the data can be studied at several different scales. Users can examine local detail, create regional maps or calculate averages for the UK as a whole.
This flexibility is particularly valuable when describing the UK’s climate. A national average temperature, for example, does not mean that every part of the country experienced the same conditions. Instead, it is a spatial average calculated using the grid squares across the UK, summarising a complex national picture in a single statistic.
Putting today’s weather into historical context
HadUK-Grid is not limited to recent conditions. For some climate variables, its records extend back for well over a century, provided there are enough robust observations available. This creates a consistent historical record that is less dependent on the opening or closing of any individual weather station.
That long-term view allows scientists to compare current conditions with the past in a consistent way. It helps provide the evidence behind statements such as “warmest year on record”, “wettest winter” or “sunniest month”. These assessments are not based on one station or one part of the country. They draw on a robust, peer-reviewed method that brings observations together to represent the UK more completely.