Windrush Weather

Tag: featured

  • Summary for December 2016

    Summary for December 2016

    In 1862, George Elliot, the novelist wrote: “The constantly heavy-clouded and often wet weather tends to increase the depression. I am inwardly irritable and unvisited by good thoughts”.

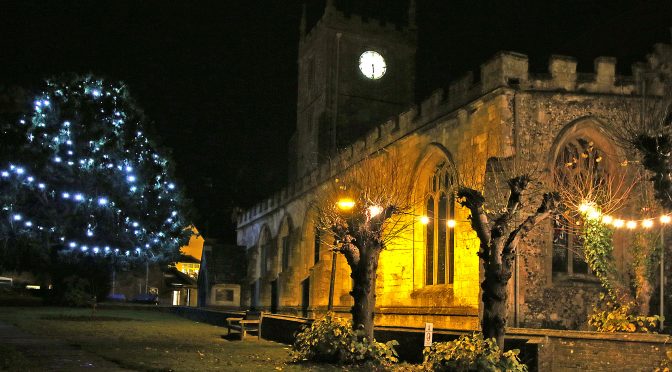
    There were so many days in December when this description applied as the very thick, low cloud and days with fog occurred all too frequently. There were sixteen days when no UV light was measurable and thick fog, with visibility down to 100 metres, on four days.

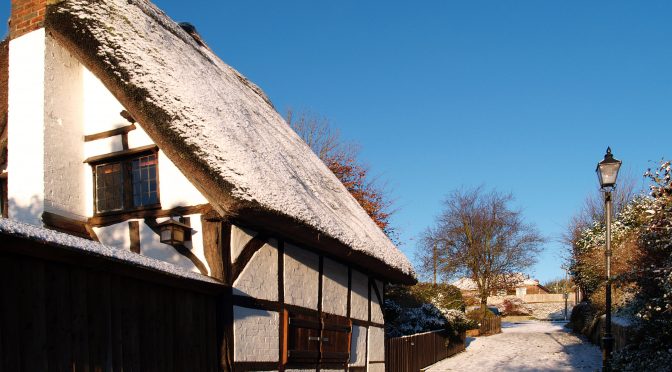
    December was mild and very dry, which climatologically is a relatively rare combination because typically mild Decembers are wet and cold Decembers are dry.

    Although there were thirteen days with measurable precipitation the rainfall for the month amounted to just 22.6mm. The wettest day was the 10th when 8.5mm fell, over a third of the total for the month. This makes December 2016 the third driest December I have recorded since the station was started in 1984 and the driest month of 2016. It is no wonder that the Rivers Kennet and Og are running so low.

    The 32-year average was 91.5mm, making a deficit of 68.9mm. The two previous very dry Decembers were in 1991 and 1988 with 21.8mm and 17.6mm, respectively. The record rainfall for December occurred in 2013 when 157mm was logged.

    It is not surprising that the Rivers Kennet and Og are running so low as although November rainfall was above average the October total was very low. The rainfall for the whole of 2016 was 767 mm, which is 91% of the 32-year average or 72mm below.

    Although there were eleven days when an air frost occurred, it was a mild month with the mean 0.7C above the long-term average. There were a couple of colder spells at the beginning and end of the month but twenty-one days when the maximum exceed the mean for December. The warmest day occurred on the 9th when the thermometer rose to 13.7C, which was 6C above the mean. The coldest night was measured on the 1st of the month when a minimum of -7.1C was recorded followed by -6.3C on the 2nd.

    The peak barometric pressure occurred on the 27th with a reading of 1044.9mb and any wall barometer at home, accurately set, would have shown the arm far around to the right at the ‘Very dry’ setting. In fact it was the highest December barometric pressure I have recorded since 1991.

    Many days were very calm as the intense high pressure dominated for much of the month. This resulted in many days with stagnant air and some days with hardly a movement of the air for extended periods. For example, on the 27th the anemometer measured a peak of just 5mph for the whole day with two very similar days when a maximum was 6mph, which cannot be classed as a gust of wind, just a brief movement of air. In contrast to this calm scene was a very breezy day that occurred on the 23rd when a maximum gust of 41mph was recorded.

    To look on the bright side there fifteen days with strong sunshine, the sunniest occurring on the 29th with 5.77 hours.

    The very dry Decembers of 1988 and 1991, as mentioned above, were followed by very dry Januaries with between a half and a third of the mean monthly rainfall. However, January 1989 was mild and January 1992 cold, so no consistent trend there. What will January 2017 bring?

  • Summary for November and Autumn 2016

    Summary for November and Autumn 2016

    Summary for November and Autumn 2016

    November
    The month began with mostly dry days and daytime temperatures around the average for November with air frosts on seven successive nights. This changed dramatically from the sixteenth as winds backed into a westerly quadrant with very wet days, the wettest being the 19th with 25.2mm

    The period from the 16th to the 22nd brought 70% of the month’s rainfall. It was all change again from the 23rd as an anticyclone built, bringing winds from the northeast. The drier air from this direction gave us eight successive days without precipitation.

    The predominant wind was from a northeasterly direction on 10 separate days, mostly at the end of the month. It was a breezy month with maximum gusts into the 20’s on 16 separate occasions with the strongest gust of 37mph on the 17th. The sunny days at the end of the month brought quieter weather with a very calm day on the 30th giving a maximum gust of just 6mph then after midday it dropped out almost completely.

    The rainfall total was 117.1mm being 128% of the November mean or +25.5mm. Although it was a wet month the records show that 1990 was the driest November since 1984 with 27.8mm and by contrast 203.5mm in 2002.

    It was a cold month giving a mean 1.6C below the 32-year average, being the coldest November since 2010. There have only been five colder Novembers since this station began in 1984.

    The occurrence of air frosts in November has been a declining feature. However, 2016 gave us 13 nights with an air frost, the highest total since 2005, when the average is 6. There were several sharp air frosts in the second week but on the morning of the 30th the thermometer had dropped to -7.3C, which was the coldest November night since 2005.

    By the morning of the 30th the cold days and very frosty nights meant that the ground had frozen down to a depth of 5cm, with a reading of -0.5C.

    There were 54.8 hours of strong sunshine, which is far greater than that recorded in 2015 and 2014, which gave us 16.4 and 41.4 hours respectively. There were eleven days when no sunshine was recorded due to the persistent low heavy cloud. But, there were several days, principally at the end of the month, when we had beautiful blue skies with almost continuous sunshine. The last three days produced 6.2, 6.1 and 5.3 hours respectively.

    On the 1st and 2nd the days began with fog, down to 150m and 200m respectively.

    Just before dawn on the 18th there was a light fall of wet snow.

    Autumn
    The three months from September to November produced contrasting temperatures. September was above average, October about average followed by the cold November. Overall the mean was close to the 32-year average being 0.1C above. However, this was the coldest autumn since 2012.

    The rainfall total for the three months was 206mm, which is 86% of the long-term average or 35mm below the average. It was the driest November since 2011. It is interesting to see the range of rainfall for this month over the last 32 years. In 1985 we had the driest November giving just 116mm and the wettest in 2006 with 401mm.

    The total hours of strong sunshine for these three months was 238 hours. This was 26 hours greater than the average for the previous two years when this instrument was installed.

  • Summary for October 2016

    Summary for October 2016

    This quotation from John Burroughs (1837-1921), an American naturalist, is so apt for the last couple of weeks. He is best known for his observations on birds, flowers and rural scenes. “October’s Party. How beautifully leaves grow old. How full of light and colour are their last days”.

    Our weather is still breaking records. We have just enjoyed 23 dry days, average is 13, with a total of just 31.5mm of rainfall. This makes October 2016 a record month for my weather station with minimal rainfall of just 31.5mm, the driest since 1984.

    Looking at my records I note how this month can be so different from another in that the previous driest was in 2003 with 36.8mm but the following October was a washout with 159.3mm. The 33-year average is 88.1mm. October was the second driest month in the year, after July, which is surprising being an autumn month.

    The wettest day occurred on the 1st with 12.0mm with the second wettest on the 15th with 7.9mm. These two days make up two thirds of the rainfall recorded in October.

    When the records for wind direction are studied the reason for this dry weather becomes clear. The winds for the month have been predominantly from the north to east quarter. There were several days with light drizzle brought in from the North Sea and four days with daily rainfall that was less than 1mm.

    Although we did have many days with several hours of strong sunshine, the end of the month brought a number of days with thick, persistent cloud. The high pressure trapped beneath it stagnant air that was reluctant to move due to minimal wind. On the 25th and 31st the maximum gust all day was just 9mph and many hours when the wind dropped out altogether.

    Analysis of the data for barometric pressure shows that the average daily pressure for October was the highest I have recorded for this month with 1023.3mb – another reason for the dry month.

    The latter half of October is the time when, as a rule of thumb, evaporation of moisture from plants and ground sources into the atmosphere is overtaken by rainfall totals. At this point precipitation exceeds evaporation, which allows the rainfall to percolate down through the soil to the aquifers. October 2016 is an exception in that the evaporation for the month of 31.6mm is greater than the rainfall total of 31.5mm

    The many dry days this month produced 95.4 hours of strong sunshine. This total exceeds those for the last two years, 2014 and 2015 gave us 65 and 68 hours respectively, since this instrument was installed.

    Even though we had many dry days and much sunshine it was not a record month for temperatures. The beginning of the month was warm with maxima a few degrees above the mean but noteworthy was the 31st when the last of the very mild air pushed the thermometer to 17.6C. In fact the mean for October was 0.14C below the 33-year averages.

    At least one air frost has occurred each October, sometimes as many as six, in the 1980’s and 1990s. However no air frost occurred in the year 2000, with several years since frost-free, but the last four consecutive years have also been frost-free.

    There were four days in the month when fog formed overnight with visibility down to 200 metres although when the 31st dawned this dropped to 100 metres before the sun broke through.